Introduction
When electromagnetic pickups were first applied to guitars the goal was to make a louder instrument. I’m sure it didn’t take long to realize that the new electric guitar not only sounded very different from an acoustic guitar, but the sound was full of new musical potential. Also the timbre was surprisingly dependant on the construction and placement of the pickups as well as combinations of pickups.
A pickup placed near the neck has a deep rich sound while a pickup placed near the bridge has a bright jangly sound. A pickup placed in between those locations has a brassy sound. None of these sound much like an acoustic guitar, or any other instrument.
On an acoustic guitar every component of the string vibration is audible. Longitudinal waves, transverse waves, along any axis, any direction, every harmonic; they all eventually find their way to being a force on the bridge and thus a contributing component of the sound of the instrument. On an electric guitar only the displacement of the string at the pickup location is sensed, and then only the displacement of transverse waves along the axis of pickup sensitivity.
This concept of tapping off one specific aspect of a complex mechanical interaction as an electrical voltage and presenting it to an amplifier and speaker was a new process to use for a musical instrument. Later developments along these lines gave us, in roughly chronological order, the Hammond organ (electromagnetic pickups on tonewheels), the electric bass (electromagnetic pickups on strings), the Rhodes piano (electromagentic pickups on tines), the Wurlitzer piano (electrostatic pickups on reeds), and the Hohner Clavinet (electromagnetic pickups on strings). In all these cases the electrical signal recovered from a mechanical process sounds fundamentally different from any acoustic sound of that same process.
Presented here is an analysis of some of the effects of pickup position and width, including the derivation of frequency response equations and plots based on those equations. Also, since the Roland VG-8 Virtual Guitar System emulates these very response curves I’ve included a short review of the patents for that device.
I won’t be covering the electrical characteristics of pickups, the effects of multiple pickups, instrument body resonsances or some of the other effects on the sound of an electric instrument here. Another article, Response Effects of Guitar Pickup Mixing, examines some issues involved in mixing the signals from multiple pickups.
Pickups and a Vibrating String
Pickup response due to position
Effects of pickup width
Roland fakes it
Conclusion
Footnotes
References
Pickups and a vibrating string
Figure 1 is a drawing of a string such as you would find on an electric guitar or electric bass. The nut is on the left, the bridge is on the right and three pickups are positioned in typical “neck”, “middle” and “bridge” locations. The drawing is to scale horizontally, but not vertically. The string “scale length”, or distance between the nut and the bridge, is 25.5 inches. The neck, middle and bridge pickups are positioned 6.375, 3.875 and 1.625 inches from the bridge respectively. These values are directly modeled after the Fender Stratocaster (see note below).
Figure 1. A vibrating open string with a scale length of 25.5 inches and three pickups located at 6.375 inches (neck), 3.875 inches (middle) and 1.625 inches (bridge).
The blue strips in the drawing designate the output level of the vibrating string sensed at the pickup positions. Not surprisingly, the output increases as the pickup position approaches the center of the string.
I need to point out that I’m glossing over two effects that cancel each other out. One is the fact that magnetic pickups respond to the change in magnetic field, and thus the velocity and not the displacement of the string. For a given string and a given displacement, the pickup output will grow proportionally as the frequency increases.
The other effect is that vibrating strings with a given energy have a displacement that is proportionally less for higher frequencies. You can observe this if you stare at the guitar strings while playing an open string and its harmonics.
So for a given string, the displacement decreases with frequency, while the sensitivity of the pickup increases with frequency. In these article I refer to the displacement sensed by the pickup relative to the open string, letting the pickup’s sensitivity to velocity and the string displacement dependance on frequency cancel each other out.
How about optical or electrostatic pickups? They are sensitive to the string displacement instead of velocity and will need a 6dB/octave high frequency boost to avoid being bass-heavy.
Will lower-tuned strings show a lower output with magnetic pickups? Yes, except that lower-tuned strings have more moving mass, and thus more magnetic sensitivity, to compensate. So it all works out.
Figure 1 is the simplest case; the string is vibrating at the fundamental frequency on the “open” (or unfretted) string. String vibrations also include sustained harmonic frequencies as well as transient vibrations. The sustained harmonic vibrations are of special interest because they define the overtone series of the guitar’s sound.
Figure 2 shows the same string vibrating at the fundamental and second, third, fourth and fifth harmonics. The harmonics can exist either as components of any played note, or forced out individually by playing a note with a finger lightly pressed over a node point on the string. (A “node” is a point where a string has minimal motion. Besides the endpoint nodes at the bridge and nut, harmonic vibration shows additional nodes in between. An “antinode” is a point where the string has maximum motion.)
Figure 2. The string vibrating at the fundamental, second, third, fourth and fifth harmonics.
It is interesting to explore some of the harmonics individually.
Fundamental frequency. As before.Second harmonic. There is a node at the center of the string and two antinodes located at 1/4 and 3/4 the length of the string. In this drawing one of the antinodes is located directly above the neck pickup.
Third harmonic. Two nodes, three antinodes. At this higher pitch the output of the neck pickup is substantially lower.
Fourth harmonic. This is an interesting case because there is a node positioned exactly over the neck pickup and the pickup will not have any output at this frequency. Many electric guitar models have their neck pickup positioned one quarter of the scale length from the bridge. If you have one of these instruments handy, try comparing the sound of the open string fourth harmonic on the various pickups.
Fifth harmonic. Here both the bridge and neck pickup signals are more substantial. The strip is red here to indicate that displacement is in the opposite direction, or “out of phase”, with respect to the string motion near the bridge. If the two pickup signals are added together there will be some cancellation of this harmonic.
Of course fretted notes are used for more often than open strings on a guitar. For fretted notes the same harmonic vibration patterns occur, subject to mechanical resonances of the instrument and the physics of the string of course, but over a smaller length of the string.
Figure 3. The fundamental, second, third and fourth harmonics of a note played at the 12th fret.
Figure 3 is the same instrument as the previous figures, but with a note played an octave up at the 12th fret instead of an open string. As far as the pickup is concerned, the effects of the nodes and antinodes are due to the wavelength on the string and not whether the string vibration is a due to a fretted fundamental or a harmonic.
Pickup response due to position
The task here is to derive an equation to describe the variations of the frequency response of a pickup due to the position of the pickup along the length of the string. First we’ll assume that the pickup senses the string motion at exactly one point, then we’ll move on from there.
My college physics text, Halliday and Resnick, includes two chapters that are very helpful; “Waves in Elastic Media” and “Sound Waves”. The book doesn’t cover the specific case of guitar strings and pickups (damn!), but it does develop equations for vibrating strings from an analysis of standing waves. A slight variation on one of the textbook equations provides the output of a pickup at positions along a string:
Where:
Vpickup is the relative displacement velocity, and thus the relative pickup output level, at this point on the string. A value of 1.0 is the maximum.
Xpickup is the position of the pickup, the distance between the bridge and the center of the pickup in inches.
Lvib is the vibrating length of the string in inches. For a harmonic, use the distance from the bridge to the first node. For the fundamental mode on an open string, this is the scale length.
Throughout this article I specify linear distances in inches because most guitar specifications are in inches. In every equation the linear units are used in ratios, so any consistant linear unit will work fine.
A frequency response can be computed by relating the vibrating string length to frequency. It’s an inverse relationship.
Where:
Fstring is the frequency of the vibrating string in Hz, whether the pitch is due to the fundamental or a harmonic of a fretted note or open string.
Fopen is the fundamental open (unfretted) frequency of the string in Hz.
Lscale is the length of the open (unfretted) string in inches.
Substituting in:
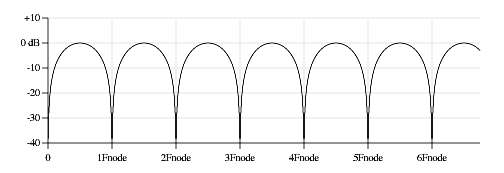
Figure 4 is a plot of this function on a linear frequency horizontal scale and dB amplitude vertical scale . There are null points in the response every Fnode Hz, where Fnode is:
Fnode is also the pitch of the string if the string was fretted at the pickup location.
Figure 4. Pickup response plotted with linear frequency and dB amplitude.
This curve is called a “comb filter” because the frequency response shape resembles the teeth of a comb. Comb filter responses are often associated with time delays (echoes, flange effects, chorus effects). Here that time delay is related to waves on the string reflecting off the bridge and the fret or nut.
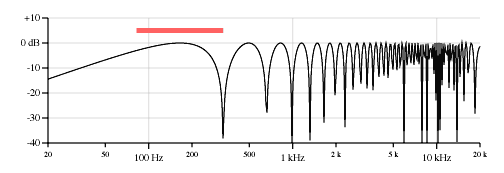
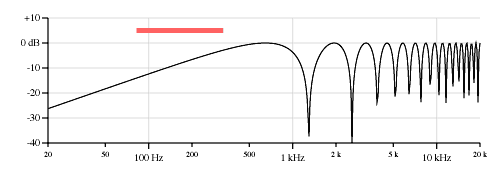
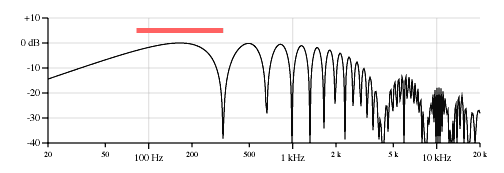
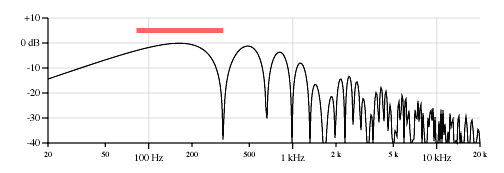
Figure 5 shows the frequency response on a log-log plot (log frequency and dB amplitude) of a neck position pickup as on a Stratocaster low E string (82 Hz open string, 25.5 inches scale, pickup located 6.375 inches from bridge).
Figure 5. Response of the neck pickup on the low E string, 82 Hz, 25.5-inch scale, pickup located 6.375 inches from the bridge. The first peak is at 165 Hz, the first null is at 330 Hz.
(As an aside, the first time I plotted this curve was in high school, probably around 1973. That was a BASIC program running on a Hewlett-Packard 2114B minicomputer, outputting dots to an ASR 33 Teletype. The version you see here is a three page PostScript program. This version is much prettier.)
As a reference, the colored bar above the curve shows the frequency range of the fretted notes on a two-octave fingerboard. Frequencies to the right of the bar are thus only available as harmonics, or if the instrument is played with a slide. Guitar strings cannot support subharmonics, so sustained frequencies to the left of the bar would only be audible if the neck length were extended.
This comb filter effect means that the notches will be cramped together at the high end of the log frequency plot. The chaotic nature of the response plot at the high end is due to drawing limitations; I’ve plotted the curve at each horizontal pixel and at the far right each pixel covers a number of comb filter cycles. Note that most pickups cut off frequencies above 8 kHz or so depending on the inductance and capacitance of the pickup.
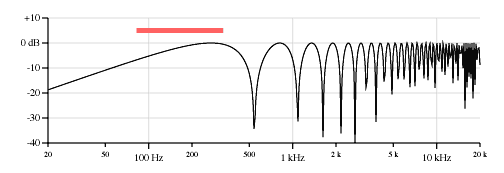
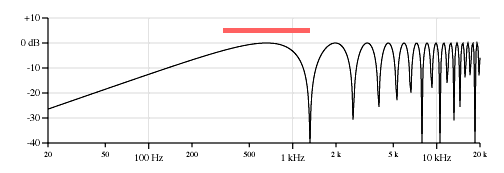
Figure 6 shows how the response curve shifts for the neck, middle, and bridge pickup positions.
Neck pickup, 6.375 inches from the bridge, first peak 165 Hz, first null 330 Hz.
Middle pickup, 3.875 inches from the bridge, first peak 271 Hz, first null 542 Hz.
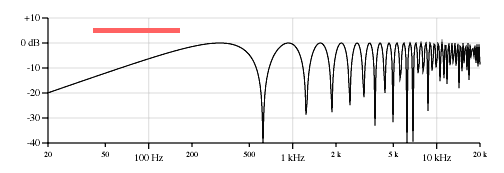
Bridge pickup, 1.625 inches from the bridge, first peak 637 Hz, first null 1274 Hz.
Figure 6. Response curves for point pickups, low E string, 82 Hz, on the example Stratocaster, 25.5 inch scale.
Note that the low end of the response drops off as the pickup moves toward the brige. The output of the open string is roughly 10dB lower on the brige pickup compared to the neck pickup. And note how the frequencies of the first peak rise as the pickup moves toward the bridge.
On an electric instrument these comb filter curves provide an effect functionally similiar to the body resonances of an acoustic guitar, providing an interesting character to the sound. (The actual body resonances of an electric instrument are certainly significant to electric sound, but not in the same way as the acoustic effect).
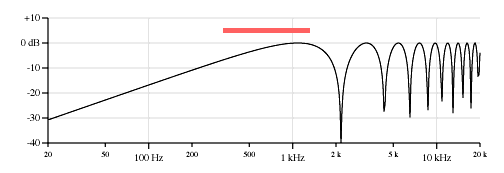
One aspect about these curves that is very different from the body resonances of acoustic instruments is that the curve is with respect to the string tuning, and the curve will scale up and down with the pitch of the open (non fretted) string. Figure 7 shows a set of plots similiar to Figure 6, but for the high E string tuned to 328 Hz.
Neck pickup, 6.375 inches from the bridge, first peak is at 659 Hz, the first null is at 1319 Hz.
Middle pickup, 3.875 inches from the bridge, first peak 1085 Hz, first null 2169 Hz.
Bridge pickup, 1.625 inches from the bridge, first peak 2586 Hz, first null 5173 Hz.
Figure 7. Response curves for point pickups, high E string 328 Hz, on the example Stratocaster, 25.5 inch scale.
Notice how these “resonances” will scale with the tuned pitch of the open string, as if it were an acoustic instrument with a separately tuned sound chamber for each string.
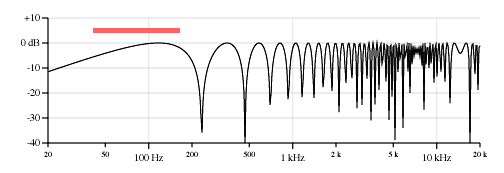
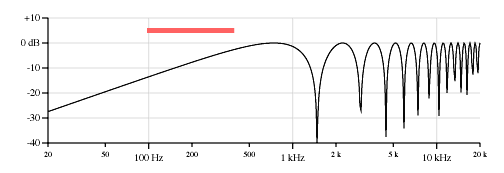
Also for electric bass players, here are the equivalent curves for the two pickups on a Fender Jazz Bass. Figure 8 shows the bass E string and Figure 9 shows the G string.
Neck pickup, 6.0 inches from the bridge, first peak 117 Hz, first null 233 Hz.
Bridge pickup, 2.26 inches from the bridge, first peak 311 Hz, first null 623 Hz.
Figure 8. Response curve for point pickups, Fender Jazz Bass, low E string 41.2 Hz, 34 inch scale.
Neck pickup, 6.0 inches from the bridge, first peak 278 Hz, first null 555 Hz.
Bridge pickup, 2.25 inches from the bridge, first peak 740 Hz, first null 1481 Hz.
Figure 9. Response curve for point pickups on a Fender Jazz Bass, G string, 98 Hz, 34 inch scale.
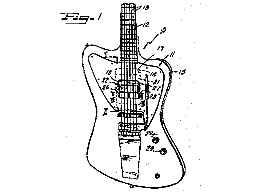
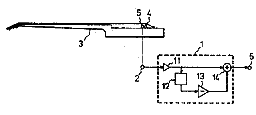
And since we’re talking about moving pickups around, this would be a good time to point out that there have been at least two instruments in production with sliding pickups; the Gibson “Grabber” bass and a Dan Armstrong model.Here is a drawing from Stanley Rendell’s Gibson patent US 3,911,777: Electric guitar with slidable pickup beneath strings. You can check out the patent below.
Effects of pickup width
Pickups do not sense the string at a single point source, but rather over an area due to the width of the magnetic field. This sensing area is called the “aperture” of the pickup and is about an inch wide on a thin single coil pickup and about 2.5 inches wide on a wider pickup such as the Gibson humbucker.
The effect of the pickup aperture on the response can be calculated by averaging the point response over the aperture length. This isn’t completely accurate, the pickup sensitivity will be greater in the middle than at the ends, but this makes a fine first approximation.
Where:
Wwidepickup is the width of the wide pickup in inches.
Performing the integration:
![Vwidepickup = ((Lscale Fopen) / (pi Fstring))[-cos((pi Fstring(Xpickup + 0.5Wpickup))/(Lscale Fopen))+cos((pi Fstring(Xpickup - 0.5Wpickup))/(Lscale Fopen))]](http://www.till.com/articles/PickupResponse/images/eq2b.gif)
Given the classic geometric equality from high school math:
And its companion:
Subtracting the first from the second:
Applying this to our equation above:
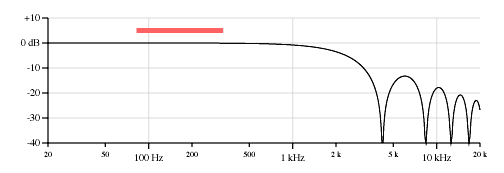
Figure 10 shows the response of a neck pickup 1.0 inches wide on the low E of a Stratocaster. Figure 11 is the same thing, but the pickup is 2.5 inches wide. Note that the original point pickup response is readily apparent, but it is multiplied by a second comb filter.
Figure 10. Response of a 1.0 inch wide neck pickup on the low E string.
Figure 11. As above, but with the pickup is now 2.5 inches wide.
This form of the equation is especially interesting because the two parts of the equation are separable — the comb filter due to the pickup position is separate from the comb filter due to the pickup width. Here is the equation for the effect of pickup width alone:
Where:
Vpickupwidth is the relative output voltage level due to the pickup width only.
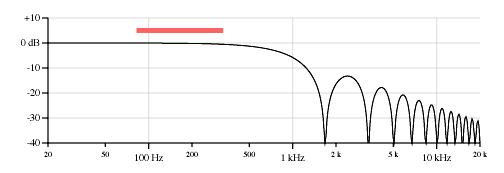
Figures 12 and 13 are response plots of the only effect of pickup width of pickups 1.0 inch and 2.5 inches wide respectively. This is a 6dB per octave low-pass comb filter with a -3dB tuning of approximately 0.866 LscaleFopen/Wpickup. The effect of pickup width scales with the pitch of the open string, but is independant of pickup position. Each of the nulls is due to an integral number of wavelengths under the pickup.
Also interesting to note is that this low pass filter effect is without phase shift or delay from the original string vibration.
Figure 12. The filtering effect of a 1.0 inch wide pickup on the low E string. -3dB point 1820 Hz, first null 4200 Hz.
Figure 13. The filtering effect of a 2.5 inch wide pickup on the low E string. -3dB point 728 Hz, first null, 1680 Hz.
Roland fakes it
Roland has a device out called the VG-8 Virtual Guitar System that attempts to simulate the effects of various pickup placements with digital filters. I have not played this unit, so I can’t comment on its performance. But since it implements the response curves above and the patents for it are readily available, I thought it would be good to include them here. The drawings here are from the patents.
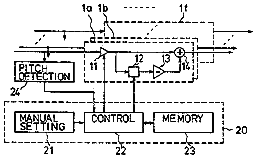
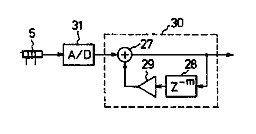
Atsushi Hoshiai’s US Patent 5,367,120, Musical tone signal forming device for a stringed musical Instrument shows most of the operation. First the basic setup; a hex pickup attaches to an electric guitar and connects to the main circuitry. A hex pickup is necessary because the filtering for each string will be different and dependant on the tuning of each string.
The comb filter is implemented by subtracting a delayed version of the signal from the incoming signal for that string. This produces a comb filter response simliar to those I have plotted above. A pitch detection scheme is used to be able to set the delay relative to the string’s open frequency.
The hex pickup is placed close to the bridge. The response of the hex pickup is flatter there, but it will still contain some nodes and antinodes. An inverse comb filter is used compensate for this effect.
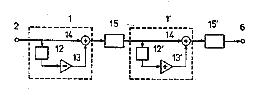
Finally a method is presented for emulating the response of a mix of two pickups in different positions using a series connection of an average pickup position comb filter and a pickup separation comb filter. I cover the math behind this in my article Response Effects of Guitar Pickup Mixing. A better approach to emulating multiple pickups is described in the next patent.
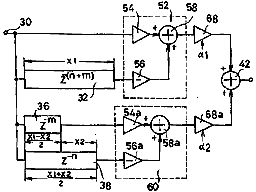
Atsushi Hoshiai’s US Patent 5,731,533: Musical tone signal forming apparatus for use in simulating a tone of string instrument covers the case of simulating two or more pickups. This patent is written in an incredibly confusing manner and it took me a while to figure out what it was all about. I think I can summarize it better:
While simply subtracting a delayed version of the input signal will generate a comb filter response similar to a single pickup a given distance from the bridge, it doesn’t work to extend this to multiple pickups because the time delay relationships between the pickups will not be correct. What’s required is to center the delays relative to a point one half the longest delay. That’s it.
You can check out the patent below.
Conclusion
A physical analysis provides equations for the frequency response of an electric guitar pickup due to the physical position and magnetic aperture of the pickup. Response plots are drawn from these equations and compares well with musician’s experience. The pickup position response is a comb filter curve and the pickup width response is a 6dB per octave low pass comb filter response.These equations only apply to the mechanical effects of position and width for sustained fundamental and harmonic vibrations. Certainly there are many more factors that affect the sound, including body resonances, the initial transient, electrical characterists of the pickups, and so forth.
Footnotes
Fender Stratocaster specs
Throughout this article I use the Fender Stratocaster as an example because it is a remarkably popular instrument, probably the most popular guitar model over the last 30 years, and because it has three pickups. I’ve also owned one for over ten years and have a good feel for the instrument.
The Stratocaster specifications I use for the examples here are:
Scale length: 25.5 inches
Neck pickup position: 6.375 inches
Middle pickup position: 3.875 inches
Bridge pickup position: 1.625 inches
Pickup aperture: 1.0 inchThese are not definitive manufacturing specs for the Stratocaster. The pickup position numbers are measured off of my personal guitar, the neck pickup position is adjusted 0.125 inch to be exactly 1/4 the scale length and I’m ignoring the fact that the bridge pickup is mounted on a slant and just using an average position for it.
I’m also ignoring bridge compensation.
Fender Jazz Bass specs
I also use the Fender Jazz Bass for the bass plots. One of my favorite instruments for sure, and a very popular bass model.
Scale length: 34 inches
Neck pickup position: 6.00 inches
Bridge pickup position: 2.25 inches
Pickup aperture: 1.0 inch
References
Response Effects of Guitar Pickup Mixing, J. Donald Tillman, July 2000. A companion to this article, this is an analysis of mixes of two and three pickups. Pickup Response Demonstration Applet, J. Donald Tillman, July 2000. A Java applet that graphically demonstrates pickup response curves based on the equations in this article.
Physics, Part 1, David Halliday and Robert Resnick, John Wiley & Sons, Inc. My copy is copyright 1966.
Electric Guitar A fellow in Australia who goes by the name “GM Arts” has written a very nice tutorial on technical guitar issues.
US Patent: 3,911,777:
Electric guitar with slidable pickup beneath strings
Inventor: Stanley Rendell
Filed: 8 August 1974
Issued: 14 October 1975
Assignee: Norlin Music, Lincoln, IL
US 3,911,777 at the USPTO
US 3,911,777 from pat2pdf.orgUS Patent 5,367,120:
Musical tone signal forming device for a stringed musical Instrument
Inventor: Atsushi Hoshiai
Assignee: Roland Corporation
Filed: 5 August 1992
Issued: 22 November 1994
US 5,367,120 at the USPTO
US 5,367,120 from pat2pdf.orgUS Patent 5,731,533:
Musical tone signal forming apparatus for use in simulating a tone of string instrument
Inventor:Atsushi Hoshiai
Assignee: Roland Corporation
Filed: 23 August 1996
Issued: 24 March 1998
US 5,731,533 at the USPTO
US 5,731,533 from pat2pdf.org“Fender Stratocaster” and “Fender Jazz Bass” are trademarks of Fender Musical Instruments Corp. I snarfed the photos from their web site.
http://www.till.com/articles/PickupResponse/index.html


